


Chapter 2
Vulnerability of transition economies to their external environment
Economic developments in the region since the deterioration of the eurozone sovereign debt crisis in the summer of 2011 clearly show that transition economies depend on the fortunes of the single currency area. Exports, capital flows and bank financing have all been affected by the euro area turmoil, resulting in lower overall growth by early 2012 in many countries and raising concerns about future prospects and possible further deterioration.
Chapter 1 of Transition Report 2011 sought to quantify the transition countries’ vulnerability to the eurozone through an index that measured, as a share of their GDP, the sum of their individual exposures in terms of exports to the area, short-term debt financing by it and FDI from it (see also Chart 2.19). It enabled the formulation of a clear country exposure ranking and identified the scale of each of the channels of vulnerability to the single currency area. The index revealed the particularly high exposure of many of the CEB and SEE countries to a downturn and instability in the eurozone, and has identified Ukraine as the most vulnerable country further east and Morocco and Tunisia in the SEMED region.
Simple correlations between the cyclical components of output growth rates of the euro area and of transition countries confirm that the business cycles of most CEB and SEE countries, as well as those of Russia, Turkey and Ukraine, are interlinked with those of the eurozone (see Table 2.1). Just like the eurozone exposure index, however, these correlations do not indicate the degree of output decline that transition countries would suffer as a result of further deterioration in the eurozone economies of a given magnitude.
Source: Eurostat, DOTS, BIS.
Note: The index is calculated as the sum of the share of eurozone countries in exports weighted by the share of exports in GDP, the share of eurozone cross-border claims on a country weighted by short term external debt as a share of GDP and the share of eurozone FDI weighted by the share FDI in GDP.
| 0 | Eurozone | Oil price | VIX | World | Russia | Saudi Arabia |
|---|---|---|---|---|---|---|
| Croatia | 0.760*** | 0.296* | -0.473*** | 0.457** | 0.670*** | 0.293* |
| Estonia | 0.678*** | 0.329** | -0.631*** | 0.434*** | 0.421*** | 0.311* |
| Hungary | 0.680*** | 0.354** | -0.546*** | 0.435*** | 0.402*** | 0.329** |
| Latvia | 0.470*** | 0.142 | -0.363** | 0.387** | 0.317** | 0.0983 |
| Lithuania | 0.621*** | 0.141 | -0.372** | 0.299* | 0.375** | 0.346** |
| Poland | 0.260* | 0.0634 | -0.192 | 0.168 | 0.224 | 0.0507 |
| Slovak Republic | 0.391*** | 0.0677 | -0.255* | 0.276* | 0.247* | 0.181 |
| Slovenia | 0.632*** | 0.369** | -0.582*** | 0.543*** | 0.446*** | 0.143 |
| Bulgaria | 0.345** | 0.182 | -0.0941 | 0.307* | 0.362** | 0.103 |
| Romania | 0.634*** | 0.297* | -0.502*** | 0.430** | 0.654*** | 0.301* |
| Serbia | 0.247 | 0.0559 | -0.135 | 0.169 | 0.164 | 0.151 |
| Turkey | 0.496*** | 0.381** | -0.400*** | 0.413*** | 0.300* | 0.373** |
| Armenia | 0.341* | 0.288* | -0.487*** | 0.262 | 0.428** | 0.00648 |
| Azerbaijan | 0.302* | -0.059 | -0.17 | 0.278* | 0.165 | -0.105 |
| Belarus | 0.377** | 0.283 | -0.442** | 0.213 | 0.300* | 0.28 |
| Georgia | 0.143 | 0.125 | -0.0763 | 0.0326 | 0.178 | 0.0211 |
| Moldova | 0.464*** | 0.252 | -0.271 | 0.214 | 0.576*** | 0.25 |
| Ukraine | 0.747*** | 0.502*** | -0.536*** | 0.462** | 0.876*** | 0.352* |
| Russia | 0.573*** | 0.516*** | -0.479*** | 0.508*** | 1 | 0.152 |
| Kazakhstan | 0.298* | 0.198 | -0.323* | 0.225 | 0.245 | 0.0706 |
| Kyrgyz Republic | 0.227 | 0.322* | -0.161 | 0.0813 | 0.252 | 0.213 |
| Tajikistan | 0.108 | 0.147 | -0.136 | -0.00635 | 0.181 | 0.015 |
| Uzbekistan | 0.0766 | 0.106 | -0.187 | 0.16 | 0.0332 | -0.122 |
| Egypt | -0.0308 | -0.0289 | -0.0412 | 0.132 | 0.0935 | -0.570*** |
| Jordan | -0.0521 | -0.284* | 0.0419 | 0.182 | -0.0455 | -0.161 |
| Morocco | 0.0182 | 0.112 | -0.0379 | -0.012 | 0.0724 | 0.0787 |
| Tunisia | -0.0866 | -0.163 | 0.0285 | 0.179 | 0.0907 | -0.619*** |
Source: Underlying data from national sources via CEIC Data and from the IMF.
Note: The table shows simple correlations between the column and row variables, which are all quarterly GDP growth rates, with the exception of oil price growth and of VIX, which is an index value. Data used extends from Q2 1995 or earliest available through Q4 2011. The trend components of all variables have been removed using the Hodrick-Prescott filter; correlations were calculated using the remaining cyclical components of the variables only. ***, ** and * denote statistical significance at the 1, 5 and 10 per cent levels, respectively.
| 0 | VIX | Oil price | World | Eurozone | Russia/Saudi Arabia |
|---|---|---|---|---|---|
| Croatia | -1** | 0.2 | 0.6* | 0.8** | 0.7** |
| Estonia | -2.5** | 0.2 | 1.3** | 1.6** | 0.2 |
| Hungary | -0.7** | 0.1 | 0.6** | 0.7** | 0.2 |
| Latvia | -2.1** | -0.3 | 1.3** | 1.7** | 0.8* |
| Lithuania | -1.9** | -0.2 | 1.4** | 1.8** | 0.8* |
| Poland | -0.3 | 0.3 | 0.7** | 0.2 | 0.4* |
| Slovak Republic | -1.3** | -0.2 | 1.4** | 0.5 | 0 |
| Slovenia | -1.5** | -0.1 | 1.2** | 0.8** | 0 |
| Bulgaria | -0.7 | 0.2 | 1.4** | 0.7* | 0.7** |
| Romania | -1** | 0.4 | 0.9** | 1.2** | 0.6** |
| Serbia | -0.9* | 0.2 | 1.3** | 0.3 | 0.6* |
| Turkey | -1.4** | 0.1 | 2.2** | 0.4 | -0.1 |
| Armenia | -2.7** | 1.1 | 1.9* | 1.5* | 2.2** |
| Azerbaijan | -1.1 | 1 | 2.7* | 1.8 | 1.5 |
| Belarus | -1.3* | 0.3 | 1.8** | 0.6 | 0.7 |
| Georgia | -0.8 | 0.3 | 1.3** | 0.7 | 1.2** |
| Moldova | -0.6 | 0.3 | 1.5** | 0.4 | 1.6** |
| Ukraine | -2.1** | 1 | 1.7* | 2.2** | 1.6** |
| Russia | -1.2** | 1** | 1.8** | 0.4 | 2.1** |
| Kazakhstan | -0.3 | 0.5 | 2.5** | 1** | 0.9* |
| Kyrgyz Republic | -0.2 | 0.6 | 1 | 0 | 0.6 |
| Tajikistan | 0.1 | 1* | 2.4** | 0.2 | 1** |
| Uzbekistan | 0 | 0.3 | 2.1** | -0.4 | 0.5 |
| Egypt | -0.3 | 0.1 | 1.5* | 0 | -0.5 |
| Jordan | 0.1 | -0.5 | 1.6** | 0.4 | 0.9** |
| Morocco | 0.2 | 0.2 | 0.9** | 0.2 | 0.3 |
| Tunisia | 0 | 0.2 | 0.5 | -0.1 | -0.4 |
Source: Underlying data from national sources via CEIC Data and from the IMF.
Note: The values in the table represent the response of the year-on-year quarterly growth rate of the row variables four quarters following a one standard deviation shock to the column variables, based on the Bayesian VAR model specified in the text. All variables are quarterly GDP growth rates, except for oil price growth and VIX, which is an index value. Last column measures response to a shock to output of Saudi Arabia in the case of the SEMED countries and to output of Russia for all other countries. Data used extends from Q2 1995 or earliest available through Q4 2011. ***, ** and * denote statistical significance at the 1, 5 and 10 per cent levels, respectively.
An econometric analysis was therefore undertaken to estimate the size of that decline in each transition country as a result of a slow-down in the eurozone (or of the gains as a result of additional growth). The analysis conflates the various transmission channels from the eurozone to transition economies – such as exports, FDI and external debt financing, which made up the exposure index – and focuses on changes in output as a whole. The same approach is used to yield vulnerability estimates for external factors other than eurozone growth, including conditions in global financial markets and oil prices. It also calculates the impact of changes in the rate of economic growth in Russia – which represents a crucial component of the external conditions of many transition economies.
The analysis is based on a statistical technique called “means-adjusted Bayesian vector autoregression” (BVAR). Quarterly growth rates of transition economies are expressed as linear functions of the previous two periods’ growth rates of each economy as well as those of the world as a whole, the eurozone and Russia (or, in the case of SEMED countries, Saudi Arabia). They are also a function of past oil price changes and realisation of the VIX index – the implied volatility of the Standard & Poor’s 500 stock market index – which is a good measure of global financial market conditions (the higher the VIX value, the more unsettled the markets).7
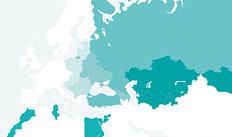
The BVAR technique enables an estimation of the response of each country’s output growth to shocks to the variables representing its external environment. Each of those shocks impact the transition country not only directly, but also by affecting the other elements of its external environment, which in turn influence the country’s growth. Table 2.2, which presents the main results, contains the cumulative impact of a typical shock (a “one standard deviation shock”) to each of the variables representing its external environment on domestic real output growth four quarters after the shock occurs. In the case of the VIX index, the “typical” shock is an 8-point change; in the case of the oil price, it is a 14 per cent change; and in the case of world, eurozone, Russian and Saudi Arabian growth, it is a change of 0.7, 0.6, 1.9 and 1.3 percentage points, respectively.8 Charts 2.20, 2.21 and 2.22 translate these numerical results into “heat maps” that visually depict each country’s vulnerability to the eurozone, to Russia and to financial market volatility, whereby the darker the shading of a given country, the higher that country’s exposure to a component of its external environment.
Chart 2.20 reveals, not surprisingly, that most of the countries for which eurozone growth has a significant impact on output are in the CEB or SEE regions. However, the ranking of countries according to the econometric analysis is quite different from that suggested by the exposure index (in Chart 2.19). According to the econometric analysis, Ukraine is the most vulnerable country to fluctuations in eurozone output, followed by the three Baltic states. In the case of Ukraine, the analysis shows that its economy is quite susceptible to external shocks in general, and that relatively small changes in its external environment can swing the entire economy in one direction or another, irrespective of whether those changes originate in the east or the west. On the other hand, output in the Slovak Republic does not seem to depend significantly on eurozone fluctuations, despite its considerable exposure to the single currency area through its export, FDI and banking links. Slovak exports are concentrated in particular industries, including cars and electronics, which have been resilient to downturns in the eurozone, and the country’s banks, while largely owned by eurozone parents, have been amply funded by domestic deposits. A similar result for Poland is perhaps less surprising: its relatively large economy with a smaller proportion of exports as a percentage of GDP has shown resilience even in the face of the global financial crisis, which is consistent with a lack of significant dependence on eurozone growth revealed in Chart 2.20. Beyond the EU and its neighbours, only Armenia and Kazakhstan appear to significantly depend on growth in the single currency area.
Germany is generally considered the main engine of the eurozone economy and is the principal trading partner of, and FDI source for, many transition countries. Is it therefore the case that the eurozone’s effect on those countries derives solely from the impact of the German economy, or do the other members of the single currency area matter as well? The question can be answered by replacing eurozone growth with German growth in the BVAR model, and comparing how transition country growth rates react to shocks to German and eurozone growth rates. It transpires that, for most countries, the influence of the eurozone as a whole in this respect is at least twice that of German growth alone, indicating the importance of the entire eurozone to economic developments in the transition region. In fact, only in Slovenia among those countries for which eurozone growth matters in the first place is Germany singularly responsible for most of that effect (although it also represents a significant proportion of the eurozone impact for Estonia and Lithuania).
Russia’s economy seems to have a perhaps unexpectedly wide geographical reach (see Chart 2.21). As expected, it affects the non-commodity exporting countries of Central Asia and the EEC region, including Armenia, Georgia, Moldova, Tajikistan and Ukraine. Most of these countries not only export to Russia but also rely on it as a source of remittances and FDI. The link between the Russian economy and those of Latvia and Lithuania is also understandable given the countries’ close proximity. Higher Russian growth, however, also appears to have a positive economic effect in Bulgaria, Croatia, Poland and Romania.
For the SEMED economies, which are economically and geographically far more distant from Russia, the analysis instead considers the impact of Saudi Arabian growth as a potential external driver. Gulf Cooperation Council countries in general, and Saudi Arabia in particular, play a similarly important role for many Middle East and North African economies as Russia does for many Central Asian and EEC countries. The analysis suggests that, of the four SEMED countries, only Jordan responds significantly to higher growth in Saudi Arabia, reflecting its closer ties with the Gulf economies through remittances, exports and foreign grants.
Among the countries analysed, a higher oil price does not appear to have a statistically significant positive effect on growth in commodity-exporting transition countries except Russia. This is perhaps because oil money does not trickle down into their domestic consumption as readily as in Russia, or because the high volatility of oil and gas production in some countries, such as Azerbaijan, makes it difficult to isolate the growth impact of oil prices. For the non-commodity exporting countries of Central Asia and the EEC such as Armenia, Georgia or Moldova, it is thanks to Russia that higher oil prices do not have a more negative impact on their economies.9
While the direct effect of higher oil prices may be negative, these countries also depend on the health of the Russian economy, which in turn benefits from higher oil prices, and therefore, on balance, they are at least no worse off.
The volatility in world financial markets significantly affects nearly all of the countries in the western transition region (see Chart 2.22). The Baltic states and Ukraine appear the most exposed, reflecting their historical dependence on external financing for continued growth. Elsewhere, the Armenian, Russian and Turkish economies also tend to contract when world financial markets become less stable. Poland, however, once again seems to be much less sensitive to external forces than virtually any other open transition economy.
It is also interesting to note that integration with the eurozone appears to attenuate the negative impact of world financial instability on transition economies.10 A worse situation in the financial markets depresses growth in the eurozone, just as it does in the transition region and elsewhere in the world. The eurozone, however, is not as dependent on external financing as emerging markets, and therefore the response of its growth to a rise in the VIX is smaller. This in turn means that countries whose fortunes are closely linked to growth in the single currency area are shielded to some extent from financial market turmoil, which hurts their key partner less than it directly affects them. For some countries, including Estonia, Romania, Slovenia and particularly Ukraine, this effect is substantial, saving them a percentage point or more of year-on-year quarterly output growth compared with how they would otherwise react in response to a typical shock to the VIX.
7 The BVAR is run on a vector of variables that includes VIX, oil price changes, world, eurozone and Russian growth as well as each transition country’s growth. All the BVARs regress the vector of variables on the first and second lag of that vector. The regressions are written in a means-adjusted form, which utilises priors on the variables’ steady state values (taken to be intervals around their long-run means). The BVARs also incorporate priors on the variables’ coefficients on their own first lags (taken from simple AR(1) processes). The transition country growth rates are treated as exogenous in the regressions, since they (except for the case of Russia) represent small economies and therefore do not affect the other variables in the model (which affect each other as well as the transition country growth rates). All models use data from Q2 1995 or earliest available through Q4 2011. For a more detailed description of the technique see, for instance, P. Osterholm and J. Zettelmeyer (2007). Details on model parametrisation are available on request (email: This email address is being protected from spambots. You need JavaScript enabled to view it.).
8 These “one standard deviation shocks” are much lighter than those experienced during the last crisis. For example, eurozone growth was about five standard deviations below its mean at the peak of the global financial crisis in the first quarter of 2009.
9 The BVAR model is estimated separately with Russia as an exogenous variable. This model specification isolates the direct impact of oil prices on each country’s growth as opposed to the baseline specification, which captures the sum of the direct impact and an indirect impact on each economy via higher Russian GDP growth due to the higher oil price. The difference between the two effects is the attenuation of the potentially negative impact of oil prices due to the concurrent positive impact of additional growth in Russia.
10 This statement is based on a variant of the analysis in which eurozone growth is treated as exogenous. See also footnote 9.