


Chapter 4
Assessment
It is too soon to judge to what extent multiple benefits of regional integration within the Eurasian Economic Community may materialise, and whether the numerous challenges and risks can, respectively, be overcome and minimised. Nonetheless, it is useful to see what can be learned from the early evidence.
Market access and trade creation
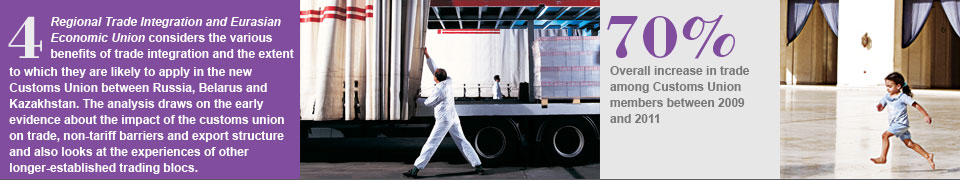
In 2010-11 intra-regional trade between Belarus, Kazakhstan and Russia increased by over two-thirds, and in the first five months of 2012 it continued to expand at the rate of 15.5 per cent year-on-year. Was this impressive growth a reflection of deeper economic integration or merely in line with global trends in the post-crisis recovery of trade?
In the wake of the 2008-09 crisis, overall imports into this Eurasian bloc contracted by 35 per cent (see Chart 4.2) and imports from within it similarly fell by over one-third. However, in 2010 imports started to recover, increasing by 31 per cent overall. This recovery was strongest for goods from China and the CIS countries followed by goods from within the new Customs Union, although some trade volumes (for example, Kazakhstan's imports from the European Union) continued shrinking. In 2011 the recovery was maintained and imports from within the Customs Union surpassed the level of 2008 in nominal terms (by 12 per cent). The trends were similar for exports.
Source: Kazstat, Rosstat, Belstat and Customs Union Commission.
Note: CU is the Customs Union of Belarus, Kazakhstan and Russia, EU-27 are the 27 current members of the European Union.
To gauge the magnitude of trade recovery effects, trade creation within and outside the Customs Union and trade diversion effects (if any), the highly disaggregated structure of exports and imports of each country can be examined. At the six-digit level of the Harmonized System (HS) classification, goods are divided into over 5,000 separate lines (such as bottles for sterilisation or washing machines, for instance). Changes in trade flows between various trading partners following the introduction of the Customs Union can be analysed by comparing the sectors where tariffs were revised and those where they were not.14
Chart 4.3 shows the distribution of tariff changes for different countries. As previously mentioned, in the case of Kazakhstan more than 50 per cent of tariff lines for non-CIS countries have been revised, and predominantly upwards (while CIS countries have retained a largely duty-free regime based on various bilateral treaties). In Belarus and Russia fewer tariff lines underwent changes and more six-digit tariff lines saw reductions rather than increases (in non-weighted terms). This is also consistent with the change in overall effective import tariff rates, calculated as the ratio of all import duties collected to all imports in a given year. For example, in Russia this ratio declined from an average of 9.1 per cent in 2006-09 to 8.6 per cent in 2010-11.15
Source: National authorities, International Trade Centre, Customs Union Commission and authors’ calculations.
Note: Distribution densities shown relate to non-trade-weighted changes in tariffs before and after the Customs Union came into force at the six-digit level of disaggregation, excluding transitional provisions and lines with no recorded imports. For intervals reported on the horizontal axis the lower bound is included and the upper bound is excluded. Both bounds are excluded in the 0 to 5 category.
Table 4.1 shows the results of a statistical analysis, undertaken separately for each member of the Customs Union, that seeks to explain changes in imports of a given product from a particular region (meaning other Union members, China, CIS countries outside the Union, the European Union or the world as a whole) in terms of past variations in import levels as well as changes in effective tariff rates since the start of the Customs Union.16 The regression analysis confirms that changes in volumes of imports between 2009 and 2010 were largely driven by trade recovery effects. For the world as a whole, a 10 per cent decline in imports during 2009 was associated with an approximately 3 per cent increase the following year in all three countries. The same was true for trade with individual partners.17 Collapses in trade during crises are indeed known to overshoot by far the contraction of demand, tending to herald a subsequent brisk recovery.18 Moreover, as trade in intermediate goods tends to be affected more than trade in final goods, some trade partnerships may be affected much more than others.
| 0 | Kazakhstan | 2 | 3 | 4 | 5 | Belarus | 7 | 8 | 9 | 10 | Russia | 12 | 13 | 14 | 15 |
|---|---|---|---|---|---|---|---|---|---|---|---|---|---|---|---|
| Dependent variable:change in imports | World | CU | EU | China | CIS | World | CU | EU | China | CIS | World | CU | EU | China | CIS |
| Change in tariffs | 0.0024 | 0.0076* | -0.0056 | -0.0141** | 0.0009 | -0.0133*** | 0.0077 | -0.0233*** | -0.0078 | -0.0015 | -0.0114*** | 0.0026 | -0.0099** | -0.0128** | -0.0061 |
| (0.0028) | (0.0039) | (0.0049) | (0.0071) | (0.0136) | (0.0032) | (0.006) | (0.0049) | (0.0132) | (0.013) | (0.0032) | (0.0084) | (0.0039) | (0.0051) | (0.012) | |
| Change in bilateral imports, 2006-08 | 0.0068 | -0.0556 | -0.1514*** | 0.0101 | 0.1102*** | -0.0033 | 0.0771 | -0.0028 | 0.0243 | -0.0721*** | -0.0495*** | 0.0553 | |||
| (0.0372) | (0.0459) | (0.0447) | (0.0579) | (0.0423) | (0.036) | (0.0491) | (0.0548) | (0.023) | (0.0258) | (0.0183) | (0.036) | ||||
| Change in bilateral imports, 2008-09 | -0.2622*** | -0.3146*** | -0.4621*** | -0.3133** | -0.3940*** | -0.3118*** | -0.0424 | -0.3606*** | -0.1474*** | -0.3024*** | -0.2980*** | -0.2346*** | |||
| (0.0507) | (0.0675) | (0.0877) | (0.1275) | (0.0594) | (0.0688) | (0.148) | (0.0916) | (0.053) | (0.0338) | (0.032) | (0.0531) | ||||
| Bilateral imports, 2009, log | -0.1267*** | -0.1495*** | -0.1569*** | -0.3110*** | -0.0452** | -0.1012*** | -0.1469** | -0.033 | -0.0567*** | -0.0606*** | -0.0499*** | -0.0807*** | |||
| (0.0217) | (0.0284) | (0.0429) | (0.0753) | (0.0191) | (0.0208) | (0.0599) | (0.0477) | (0.0196) | (0.0082) | (0.012) | (0.0217) | ||||
| Change in world imports, 2006-08 | -0.1020*** | -0.033 | 0.0479 | -0.0153 | -0.2297** | -0.0195 | -0.1110** | -0.0931* | -0.0581 | -0.0145 | -0.0651*** | 0.0143 | 0.0112 | 0.0562 | -0.0166 |
| (0.0198) | (0.0509) | (0.0662) | (0.0752) | (0.1010) | (0.0163) | (0.0536) | (0.0483) | (0.0964) | (0.1061) | (0.0128) | (0.0479) | (0.0319) | (0.0342) | (0.053) | |
| Change in world imports, 2008-09 | -0.3218*** | 0.069 | -0.2468*** | 0.1664 | -0.1135 | -0.3655*** | 0.0394 | -0.1654** | -0.1143 | 0.1658 | -0.2625*** | -0.1473*** | 0.0462 | 0.1983*** | -0.0564 |
| (0.0294) | (0.0620) | (0.0907) | (0.1116) | (0.1837) | (0.0263) | (0.0759) | (0.0819) | (0.1974) | (0.1411) | (0.0174) | (0.0542) | (0.0376) | (0.0453) | (0.0713) | |
| World imports, 2009, log | -0.1111*** | -0.0500*** | -0.0446*** | ||||||||||||
| (0.0129) | (0.0104) | (0.006) | |||||||||||||
| Constant | 0.7099*** | 0.3902** | 0.9338*** | 1.5044*** | 2.4767*** | 0.4791*** | 0.4085** | 0.8852*** | 1.3077*** | 0.3447 | 0.6569*** | 0.5253*** | 0.7264*** | 0.8743*** | 0.8454*** |
| (0.1159) | (0.1978) | (0.2460) | (0.3662) | (0.6562) | (0.0891) | (0.1605) | (0.1736) | (0.4675) | (0.3884) | (0.0581) | (0.1731) | (0.0776) | (0.1064) | (0.1959) | |
| Number of observations | 1323 | 486 | 542 | 295 | 156 | 1578 | 640 | 747 | 143 | 187 | 2917 | 508 | 2084 | 1250 | 460 |
| R-squared | 0.176 | 0.1821 | 0.2995 | 0.2221 | 0.3393 | 0.1605 | 0.1795 | 0.257 | 0.1138 | 0.1374 | 0.109 | 0.0726 | 0.1293 | 0.1061 | 0.145 |
| Number of industry fixed effects | 133 | 99 | 93 | 77 | 55 | 147 | 109 | 119 | 55 | 66 | 162 | 109 | 151 | 136 | 106 |
Source: Authors' calculations.
Note: The table shows the results of ordinary least squares regressions of changes in imports in 2009-10 (in logarithmic terms). Robust standard errors in parentheses.
Values significant at the 10 per cent level are marked with *; at the 5 per cent level with **; at the 1 per cent level with ***. A negative coefficient for the change in tariffs means that imports decreased in response to a higher tariff or that tariff increased in response to a lower import tariff.
Imports also exhibited market saturation properties: the higher the pre-Customs Union import level of a given type of product from a given partner, the slower the growth in imports.
The first row of coefficients in Table 4.1 reveals that changes in tariffs per se did not have a significant impact on the aggregate (world) import flows in Kazakhstan, at least in the short term. However, they did have some effect on trade with individual partners. In particular, increases in tariffs had a statistically significant negative impact on imports from China. The coefficients imply that a 2 percentage point tariff increase (the average for the sample) led to a 2-3 per cent contraction in imports of respective goods from China. A similar increase in tariffs also led to a 1-2 per cent increase in imports from within the Customs Union.19 Imports from the European Union, CIS and the rest of the world were broadly unchanged.
The coefficients for changes in tariffs may in fact combine two effects. For increases in tariffs, which were more common in Kazakhstan, a negative coefficient means that trade declined in response to higher tariffs. At the same time, in cases where tariffs were reduced, the same negative coefficient reflects an increase in trade in response to the tariff reduction.
It is therefore useful to check for asymmetries in the response of import flows to increases and reductions in tariffs (see Table 4.2). It turns out that in Kazakhstan significant changes in trade flows were only observed in response to increases in tariffs. This means that the positive relationship observed in Tables 4.1 and 4.2 between changes in tariffs and changes in imports from Customs Union countries reflects a trade diversion effect. For example, imports into Kazakhstan from Russia may have increased because imports from China became more expensive following the introduction of a higher common external tariff by the Customs Union members.
In the case of Belarus, Table 4.1 indicates that tariff changes had a significant negative impact on overall (world) import flows. Unlike Kazakhstan, however, the positive effect on imports from the Customs Union was small and statistically insignificant. This is possibly explained by the fact that tariff changes were much less drastic for Belarus, which already had a tariff structure similar to that of Russia. At the same time, tariffs had a small but statistically significant negative impact on trade with the European Union.
Again, this raises the question of whether these negative coefficients should be interpreted as reflecting trade creation or trade diversion. Table 4.2 suggests that, as in the case of Kazakhstan, significant responses in trade flows were observed only in response to increases in tariffs. A 0.5 percentage point tariff increase (the average for the sample) was associated with a 2-3 per cent reduction in imports from the European Union and a 1-2 per cent reduction in respective imports from the world as a whole.20
The Table 4.1 results for changes in import flows in Russia appear to be similar to those for Belarus. However, Table 4.2 suggests that imports into Russia from the world as a whole, and from the European Union in particular appear to have responded to reductions rather than increases in tariffs. Trade with China and the rest of the world appears to have responded both to increases and reductions in tariffs. The greatest of these effects is apparent for imports from China, where a 2 per cent fall in tariffs (the sample average) led to a 2-3 per cent increase in imports.
The overall finding of this analysis is that changes in tariff policy have to date had a fairly limited impact on trade flows to members of the Customs Union. Tariff-related increases in imports from within the Union were particularly small and statistically significant for Kazakhstan alone, where it appears to be a result of higher external tariffs in relation to non-Union countries. In addition, tariff increases have had statistically significant negative effects on trade between Customs Union members and selected trade partners. These effects were most pronounced for trade with China, and to a lesser extent with the European Union. This indicates some degree of trade diversion. To date, the Customs Union appears to have had tariff-related trade creation effects only for Russia, as reductions in external tariffs have been associated with higher imports from selected trade partners outside the Union.
Importantly, this analysis may underestimate the eventual trade creation effects of tariff changes because of the short time period since the Customs Union came into effect. Establishing new trade links may take several years, and the speed of changes in trade flows may depend on the nature of the goods in question.21 In addition, by focusing on products that have already been traded, the analysis ignores the introduction of new exports and imports. Furthermore, trade flows in 2009 may, to some extent, already have been affected by the anticipation of future tariff changes.
These caveats notwithstanding, the findings are consistent with the view that the value of modern trade agreements derives primarily from the removal of non-tariff barriers and from investment and service liberalisation, rather than changes in rules governing movement of goods, such as tariffs and quotas.22
14 Trade flows are expressed in US dollar terms.
15 Calculated using data from the Central Bank of Russia and the Russian Treasury taking into account all import duties and fees collected in Russia, including those subsequently transferred to the Treasuries of Belarus and Kazakhstan.
16 See Isakova and Plekhanov (2012) for further discussion. Analysis excludes product lines for which exclusions from the common external tariff apply or trade volumes are less than US$ 1 million.
17 Results for the rest of the world (not reported) are similar.
18 See Baldwin (2009).
19 Customs Union estimates for Kazakhstan are based on preliminary incomplete data. See Isakova and Plekhanov (2012) for details.
20 This result is driven by a relatively small number of product lines for which the tariffs increased: 59 for the world as a whole and 29 for the European Union, predominantly in the food, automotive and construction materials sectors.
21 The analysis of changes over two years for Russia, where data are available, confirms that the effects increase somewhat over time but they remain qualitatively and quantitatively similar to those reported in Tables 4.1 and 4.2.
22 See Baldwin (2011) and Schiff and Winters (2003).